

- Download the E-Book
- What is Data Visualization?
- How Do You Employ Data Visualization in Marketing?
- Utilizing Data Visualization Dashboards to Improve Campaign Performance
- Benefits of Marketing Data Visualization Tools
- Downloadable: Data Visualization At a Glance
- Partnering with MNI for Data Dashboard Success
Seeing Is Believing. Download the E-Book:
What Makes Data Visualization Tools Valuable? It’s how information is shared through imagery. It’s storytelling.
- It helps users establish goals and targets designed to derive the maximum value from campaigns.
- It provides granular, automated reports for clients to highlight how you add value.
- It alerts users promptly when a project goes off track, empowering immediate course corrections.
- It predicts campaign outcomes.
- It provides rich customer and industry observations that help direct future campaigns.

What is Data Visualization?
Data visualization is the process of putting data points into images like charts, infographics, illustrations, and other ways of portraying data through visual cues instead of just words.
Think about a compelling article that you read recently. The actual writing does most of the heavy lifting, but if it's got equally captivating imagery between blocks of text, it tells a more compelling story. Images can also help get you in the appropriate mood, such as intrigued by a statistic or passionate about recipes.
Words have power, but images are equally evocative.
The visualization process in marketing has been studied for decades, and humans have demonstrated that they process images up to 60,000 times faster than text. When it comes to conveying data points and other key research findings that a marketer or content creator wants to make, a chart or diagram can leave a stronger imprint on readers than words alone. The more senses you engage, the more staying power the information has.

How Do You Employ Data Visualization in Marketing?
Marketing is often a very emotional process and data visualization has the ability to elevate the experience. This is often through the power of recognition.
Take niche sectors that have huge audiences, like sports betting. People will recognize team logos and colors, typefaces used, and symbols common to the game. If this is your audience, you'll want to use these aspects when communicating data to them. Iconography sparks recognition.
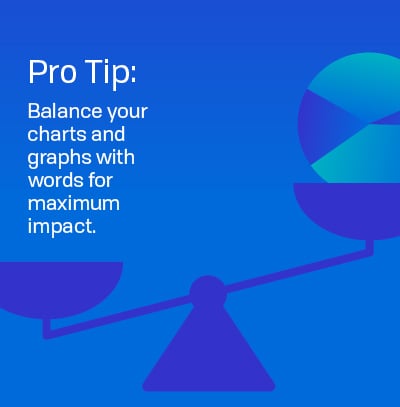
But HOW you convey that data also matters. Bar charts, pie charts, hierarchy, and process graphs, or simply placing a number or small sentence with a succession of images should easily connect the reader with the points being made. In our e-book, How Data Visualization Drives Performance, the point is made that data visualization tools in marketing are no longer a luxury but a necessity. Why? Because these platforms help marketers and agencies evaluate campaign impact and effectiveness at a glance. They are storytelling at its most practical.
Utilizing Data Visualization Dashboards to Improve Campaign Performance
How do marketers use data to identify goals? Data visualization dashboards help marketers keep a pulse on campaign performance, allowing them to track and analyze different data points and KPIs. Since every campaign is unique, data visualization dashboards are customizable and can report on information specific to a campaign's objectives and goals.
 When it comes to reporting, there is nothing like receiving the latest information to help make data-driven decisions that can impact your business—without analysis paralysis. To help provide a solution to the problem marketers face when it comes to measuring call-to-actions in Connected TV (CTV) and OTT marketing campaigns, MNI introduced Motto. Motto is a programmatic ad-buying solution that provides over-the-top (OTT) analytics. This type of analytics platform helps to provide brands with granular insights into their campaigns and ultimately maximize their return on ad spend.
Data visualization dashboards can be used across different marketing platforms to help tell the story behind campaign data points. Another digital campaign reporting dashboard offered by MNI is Optics, which gives comprehensive, visually enhanced reporting by connecting and uniting multiple data streams from different digital tactics.
Benefits of Marketing Data Visualization Tools
 With access to data visualization reporting, you can reap the benefits of easy-access information, including:
- Full Transparency
- Interactive Dashboards
- On-Demand Stats
- Complete Campaign Reporting
- Integrated Reporting
- Unique Metrics
- Aggregated Data
- Swift Optimization Recommendations
In a world where we're all moving at a lightning pace, data visualization collects and interprets information, providing real value to in-progress campaigns. These insights are then used to drive future efforts. And that is what marketers need most to be successful in the long term, iterating as they go, based on easily-synthesized data.
Downloadable: Data Visualization At a Glance
Our e-book has all the in-depth info, but if you want a quick overview of the highlights, download our Data Visualization: At a Glance guide.

Partnering with MNI for Data Dashboard Success
MNI Targeted Media thrives on bringing actionable insights to its clients. We combine data insights with the human touch to drive performance. Our goal is to make messaging personal through our Omnipoint system, Motto—our OTT attribution solution, and Optics—which tracks the most up-to-date campaign data in one interactive dashboard across all digital tactics.

